<?xml version="1.0" encoding="utf-8"?><feed xmlns="http://www.w3.org/2005/Atom" ><generator uri="https://jekyllrb.com/" version="4.4.1">Jekyll</generator><link href="https://jithinraaj.in/feed.xml" rel="self" type="application/atom+xml" /><link href="https://jithinraaj.in/" rel="alternate" type="text/html" /><updated>2026-04-08T18:59:00+00:00</updated><id>https://jithinraaj.in/feed.xml</id><title type="html">Jithin Raaj</title><subtitle>Social Media Team Lead &amp; Automation Expert at Entri. I build tools to solve operational problems I live with every day.</subtitle><author><name>Jithin Raaj</name><email>jithinrajtk@gmail.com</email></author><entry><title type="html">If I Can See It on the Screen, I Can Get It Out</title><link href="https://jithinraaj.in/writing/chrome-extensions-vibe-coding/" rel="alternate" type="text/html" title="If I Can See It on the Screen, I Can Get It Out" /><published>2026-04-08T00:00:00+00:00</published><updated>2026-04-09T00:00:00+00:00</updated><id>https://jithinraaj.in/writing/chrome-extensions-vibe-coding</id><content type="html" xml:base="https://jithinraaj.in/writing/chrome-extensions-vibe-coding/"><![CDATA[<p>There’s a dashboard at work that shows exactly what I need.</p>

<p>Numbers, live data, everything. Beautifully laid out.</p>

<p>No export. No API. Nothing. Just a page that shows you the data and expects you to manually copy it like it’s 2009.</p>

<p>I used to lose that fight. Copy, paste, format, repeat. Every single morning.</p>

<p>Now I just don’t.</p>

<hr />

<h2 id="the-python-thing-never-really-works">The Python thing never really works</h2>

<p>First instinct: write a Python script.</p>

<p>Hit the endpoint. Parse the response. Done.</p>

<p>Except internal dashboards don’t have public APIs. They load after a login. The data lives behind cookies and session tokens that only exist inside a live browser. So you get creative. Grab the cookies manually, pass them into requests, and it works. Once. Then the session expires and the script breaks. The auth flow changes and it breaks again. A rate limit gets added and now you’re debugging a hack at 9am before a meeting.</p>

<p>You spend more time maintaining the workaround than you ever saved building it.</p>

<p>I went through this enough times. It’s a dead end.</p>

<hr />

<h2 id="the-thing-that-actually-works">The thing that actually works</h2>

<p>A Chrome extension doesn’t fake being a browser. It runs inside one.</p>

<p>Same session. Same cookies. Same page you’re already looking at. If the data is on your screen, an extension can read it. No tokens to replicate, no auth to reverse-engineer. You’re already logged in. The extension just reaches in and takes what’s there.</p>

<p>That’s the whole thing. Sounds obvious. Takes a while to actually see it.</p>

<hr />

<h2 id="this-is-where-vibe-coding-changed-everything">This is where vibe coding changed everything</h2>

<p>I’ll be straight: I had no idea how Chrome extensions worked.</p>

<p>Manifest files, content scripts, service workers. There’s a whole structure to it. Enough that I never touched it.</p>

<p>Then I just described what I wanted to Claude Code:</p>

<blockquote>
  <p><em>“Build me a Chrome extension for this dashboard. There’s a table with the class <code class="language-plaintext highlighter-rouge">.lead-metrics</code>. When I click the extension icon, read every row and copy it to clipboard as CSV.”</em></p>
</blockquote>

<p>Forty minutes later it was running in my browser.</p>

<p>Not a rough draft. A working extension, doing exactly that, on a real dashboard with no export and no engineering team in the loop.</p>

<p>Forty minutes to build something that saves twenty minutes every morning. Break-even is two days.</p>

<hr />

<h2 id="what-ive-actually-shipped-this-way">What I’ve actually shipped this way</h2>

<p>A metrics extractor that reads numbers off a locked dashboard. One click, data in clipboard, formatted exactly how my spreadsheet expects it.</p>

<p>A cross-tab aggregator. Seven regional tabs, each showing data for one region. I told Cursor:</p>

<blockquote>
  <p><em>“Open each tab, wait for it to load, grab the number inside <code class="language-plaintext highlighter-rouge">.region-total</code>, close the tab, then show me everything compiled in one place.”</em></p>
</blockquote>

<p>Seven tabs of mental math became one button.</p>

<p>A form prefiller. Same ten fields, same values, thirty times a day. The extension fills everything predictable and skips the two fields that actually vary. Two minutes per form times thirty forms is an hour back every single day.</p>

<p>A page monitor that checks a supplier site on a schedule, saves the values, and tells me when something changes. No API on their end. Doesn’t matter.</p>

<p>None of these needed me to know JavaScript. Every one of them started with a plain description.</p>

<hr />

<h2 id="the-prompt-is-the-skill">The prompt is the skill</h2>

<p>This is what people miss about vibe coding.</p>

<p>Claude Code and Cursor aren’t magic. They need a clear description. The better you explain the problem, the better the first output. Vague in, broken out.</p>

<p>Three things I always include:</p>

<p>The URL or type of page. The exact element holding the data (right-click anything on the page, hit inspect, find the class name). What I want done with the data after.</p>

<p>That’s it. First version gets maybe 80% right. Two or three corrections and it’s done. The whole process feels less like coding and more like explaining something to a very capable person who just needs the specifics.</p>

<p>Claude Code is what I use when I want to describe the whole problem at once and get something fast. Cursor is better when I want to see the files, read through what it built, and tweak things myself. Both work. Pick one and just start.</p>

<hr />

<h2 id="how-i-think-about-problems-now">How I think about problems now</h2>

<p>Before this, hitting a data wall meant looking for workarounds. Is there a hidden export? Can someone from the data team pull this? Is there a third-party tool that connects?</p>

<p>Now the first question is: can I see it on a screen?</p>

<p>If yes, I can have something built today.</p>

<p>That shift matters more than any specific extension I’ve made. Problems that used to sit in a backlog somewhere now take an afternoon. The dependency on engineers, on data teams, on tickets and timelines, it’s just gone for this whole category of problem.</p>

<p>Anyone can do this. You don’t need to code. You need to know what you want and be specific about it.</p>

<p>The extension does the rest.</p>

<hr />

<p><strong>Can you build a Chrome extension without knowing how to code?</strong></p>

<p>Yes. Describe the page, the data you want, and what should happen with it. Claude Code or Cursor generates everything. You just tell it what’s wrong and iterate.</p>

<p><strong>Why does a Chrome extension work when a Python script doesn’t?</strong></p>

<p>Auth. A Python script has to replicate your browser session from outside, which breaks constantly. A Chrome extension runs inside your existing session. You’re already logged in. It just reads what’s on the page.</p>

<p><strong>What’s the best first extension to build?</strong></p>

<p>Something you do manually every day. Copying numbers off a page, filling the same form, checking the same thing. Clear input, clear output. Start there.</p>

<script type="application/ld+json">
{
  "@context": "https://schema.org",
  "@type": "FAQPage",
  "mainEntity": [
    {
      "@type": "Question",
      "name": "Can you build a Chrome extension without knowing how to code?",
      "acceptedAnswer": {
        "@type": "Answer",
        "text": "Yes. With vibe coding tools like Claude Code or Cursor, you describe the page, the data you want, and what should happen with it. The tool generates the manifest, content scripts, and permissions. You iterate on what doesn't work. No JavaScript knowledge required."
      }
    },
    {
      "@type": "Question",
      "name": "How do you pull data from a dashboard with no API?",
      "acceptedAnswer": {
        "@type": "Answer",
        "text": "Build a Chrome extension. It runs inside your browser session, so it can access anything rendered on the page without replicating auth or managing tokens. You're already logged in. The extension reads what's there."
      }
    },
    {
      "@type": "Question",
      "name": "What is vibe coding?",
      "acceptedAnswer": {
        "@type": "Answer",
        "text": "Building software by describing what you want in plain language to an AI tool like Claude Code or Cursor, then iterating on what it produces without writing code yourself. The name comes from Andrej Karpathy."
      }
    },
    {
      "@type": "Question",
      "name": "What is the difference between Claude Code and Cursor for building Chrome extensions?",
      "acceptedAnswer": {
        "@type": "Answer",
        "text": "Claude Code is terminal-first and great for describing the full problem in one go and getting something fast. Cursor is an AI-powered editor, better when you want to read through the generated files and make manual tweaks. Both work for building Chrome extensions with vibe coding."
      }
    },
    {
      "@type": "Question",
      "name": "What is the best first Chrome extension to build with vibe coding?",
      "acceptedAnswer": {
        "@type": "Answer",
        "text": "Start with something you do manually every day. Copying data off a page, filling the same form, checking the same numbers. Pick something with a clear input and a clear output, describe it with the exact element class names from the page, and iterate from there."
      }
    }
  ]
}
</script>]]></content><author><name>Jithin Raaj</name><email>jithinrajtk@gmail.com</email></author><category term="vibe-coding" /><category term="chrome-extension" /><category term="automation" /><category term="browser-automation" /><category term="claude-code" /><category term="cursor" /><category term="productivity" /><category term="internal-tools" /><category term="web-scraping" /><category term="data-extraction" /><summary type="html"><![CDATA[How I build custom Chrome extensions using vibe coding tools like Claude Code and Cursor — pulling data from dashboards, automating forms, and replacing manual workflows. No API needed. No coding experience required.]]></summary><media:thumbnail xmlns:media="http://search.yahoo.com/mrss/" url="https://jithinraaj.in/assets/images/chrome-extension-vibe-coding.png" /><media:content medium="image" url="https://jithinraaj.in/assets/images/chrome-extension-vibe-coding.png" xmlns:media="http://search.yahoo.com/mrss/" /></entry><entry><title type="html">Every Morning, the Report Already Knows What Needs Fixing</title><link href="https://jithinraaj.in/writing/okr-lead-report-automation/" rel="alternate" type="text/html" title="Every Morning, the Report Already Knows What Needs Fixing" /><published>2026-04-05T00:00:00+00:00</published><updated>2026-04-05T00:00:00+00:00</updated><id>https://jithinraaj.in/writing/okr-lead-report-automation</id><content type="html" xml:base="https://jithinraaj.in/writing/okr-lead-report-automation/"><![CDATA[<p>Picture the scene.</p>

<p>
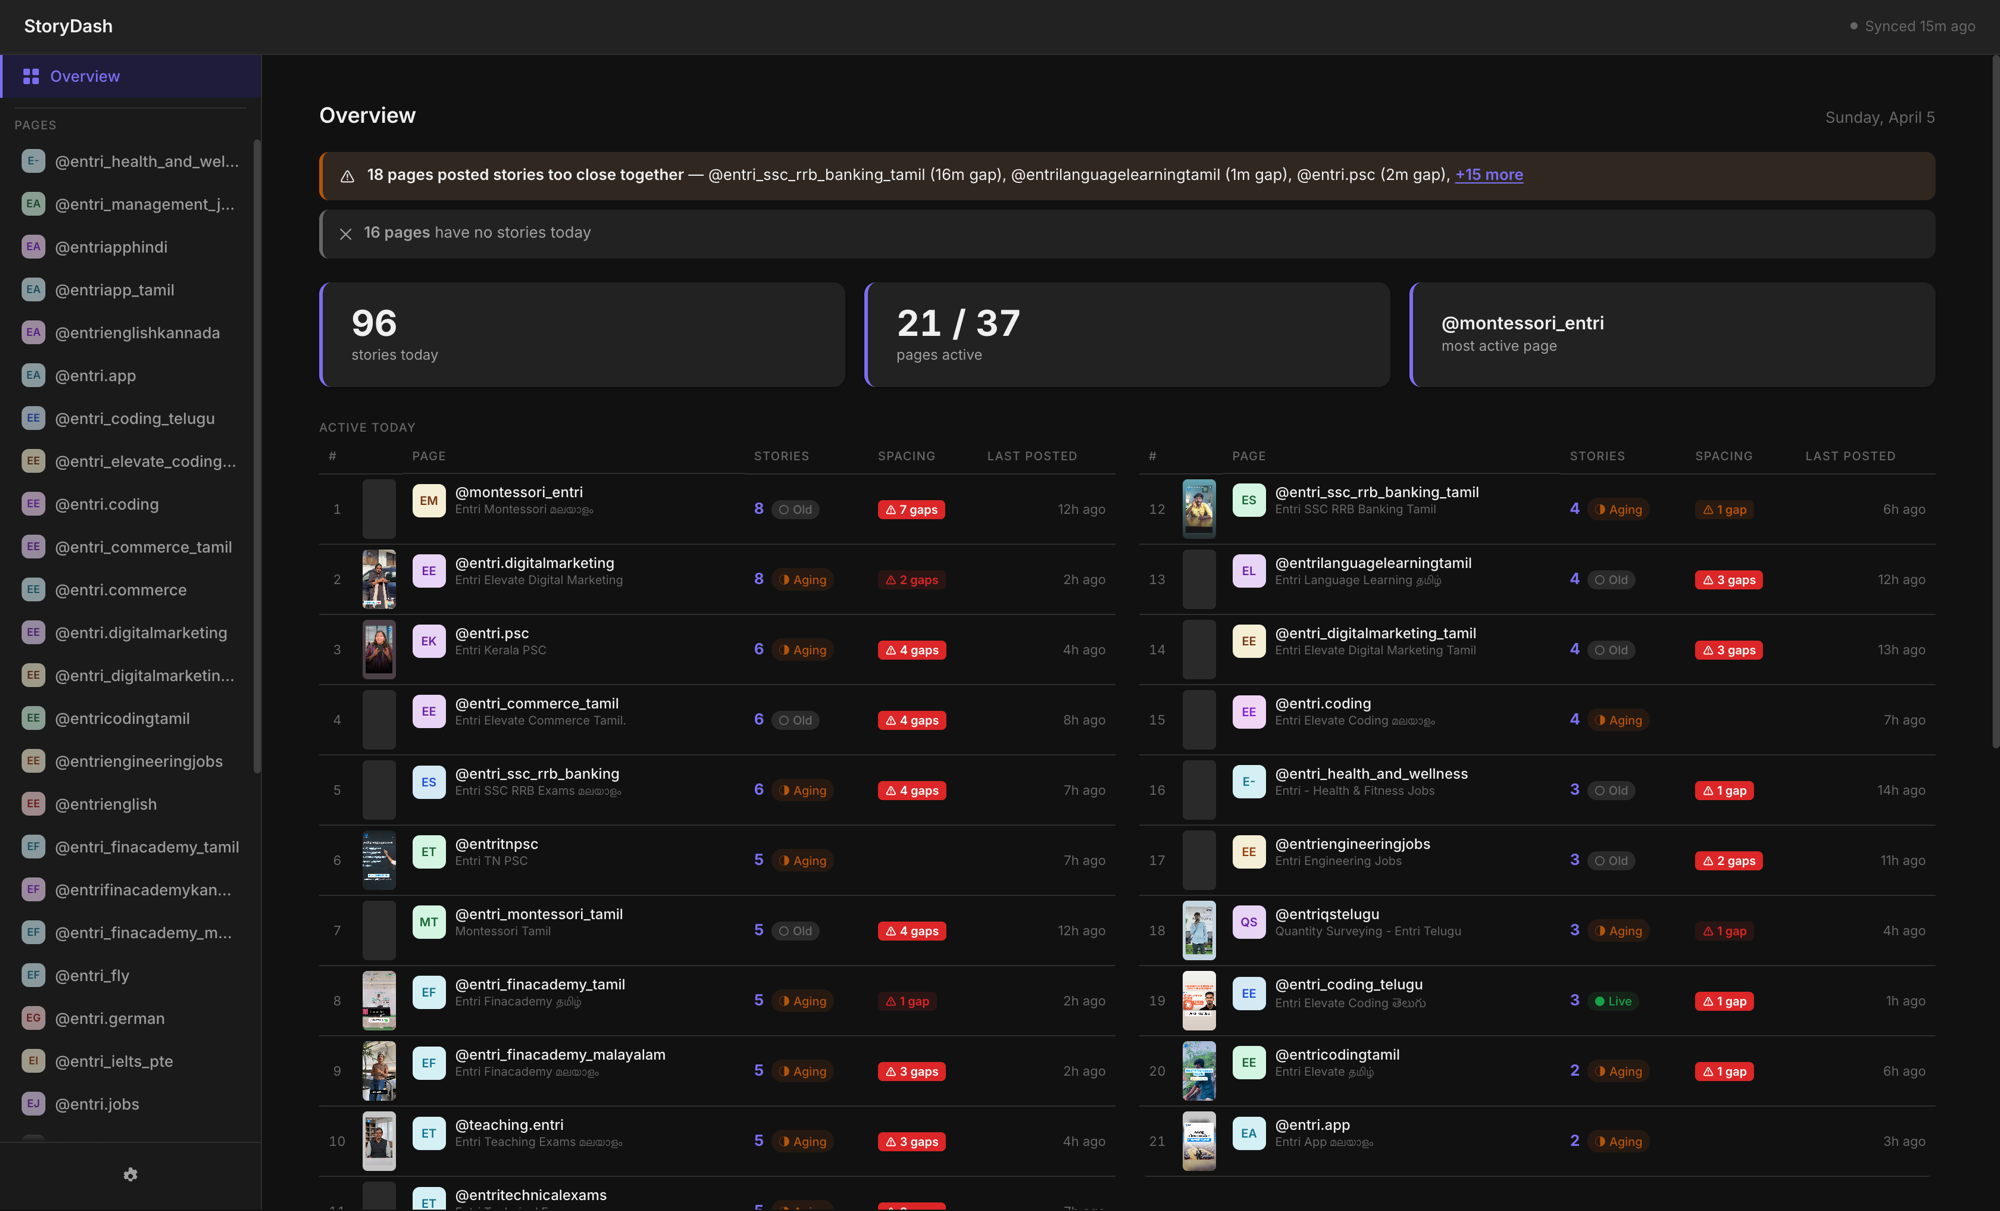
A room full of people in a meeting. The performance dashboard is open. So is a Google Sheet. Someone is running quick calculations, a spreadsheet here, an AI tool there, trying to get to the number fast enough to be useful.</p>

<p>Everyone is trying. Nobody is deciding yet.</p>

<p>This was the opening of every lead generation review. Smart people, doing their best with what was available — and still spending the opening minutes of every meeting doing math instead of making calls. That’s not a people problem. That’s a system that wasn’t set up to help them.</p>

<p>The answers always came. But they always came late.</p>

<p>That wasn’t the worst part.</p>

<hr />

<h2 id="the-data-was-already-old">The data was already old</h2>

<p>The dashboard pulled numbers till the previous day. Data for today wouldn’t show up until after midnight. So every morning meeting — the one where you’re supposed to course-correct before the day gets away from you — was running on information that was already hours old by the time anyone looked at it.</p>

<p>We were doing real-time math on yesterday’s numbers. And calling it a data-driven meeting.</p>

<p>
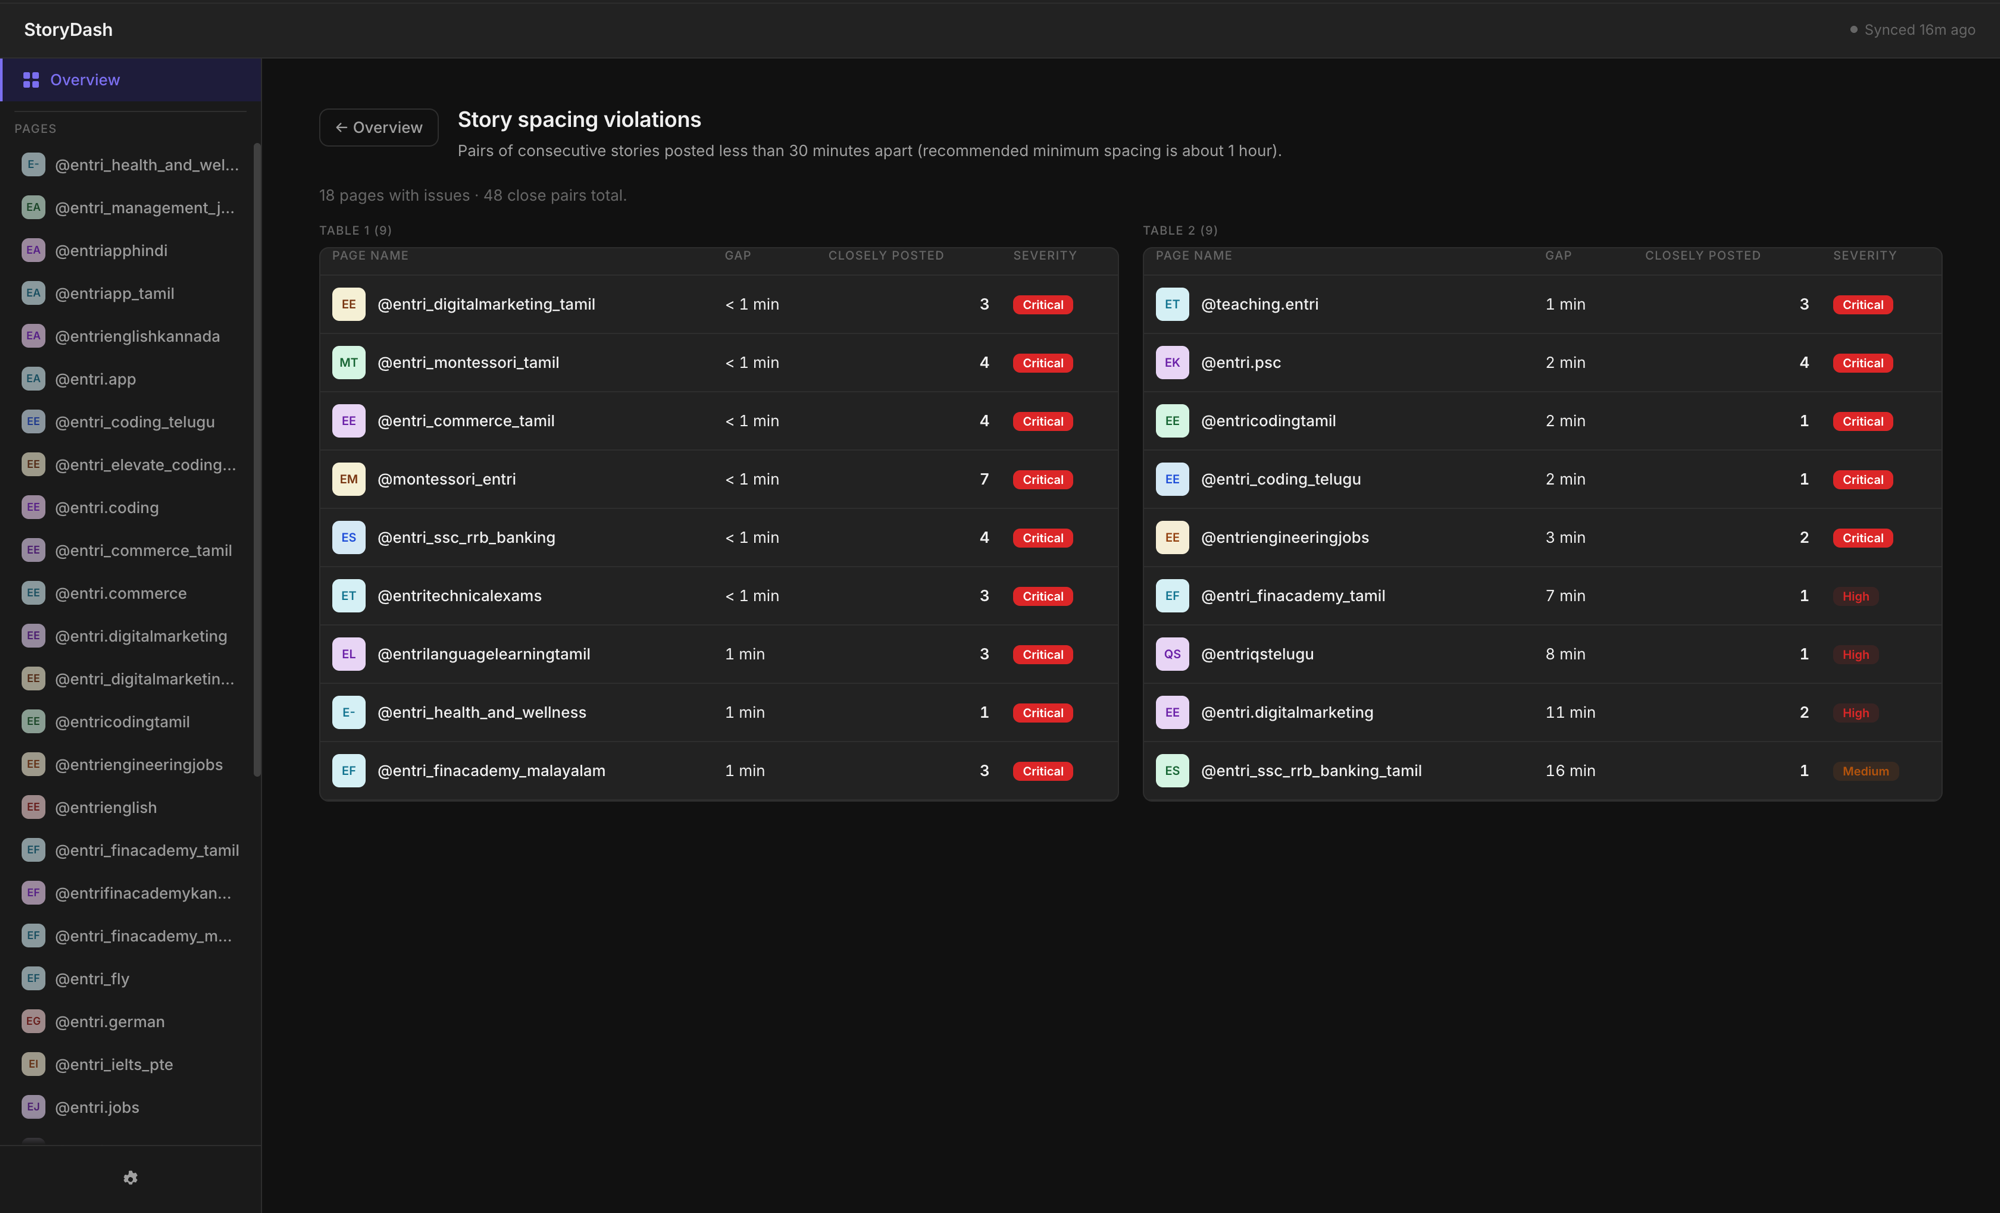
I’ve been running social media operations long enough to know what a real-time decision feels like, and what a delayed one costs. A lead category tracking at 65% on Day 10 is recoverable. The same category at 65% on Day 25 isn’t. The window to act matters. And every morning we were showing up to the window hours after it opened.</p>

<hr />

<h2 id="the-thing-nobody-says-out-loud">The thing nobody says out loud</h2>

<p>Nobody says this out loud. Someone has to be the one who <em>knows the numbers</em>. They’re always slightly under pressure to have them ready. They open the sheet, run the figures, try to remember which POC owns which category, and present while everyone else waits.</p>

<p>That person’s job in that moment isn’t strategy. It’s data retrieval.</p>

<p>Data retrieval is a computer’s job.</p>

<p>
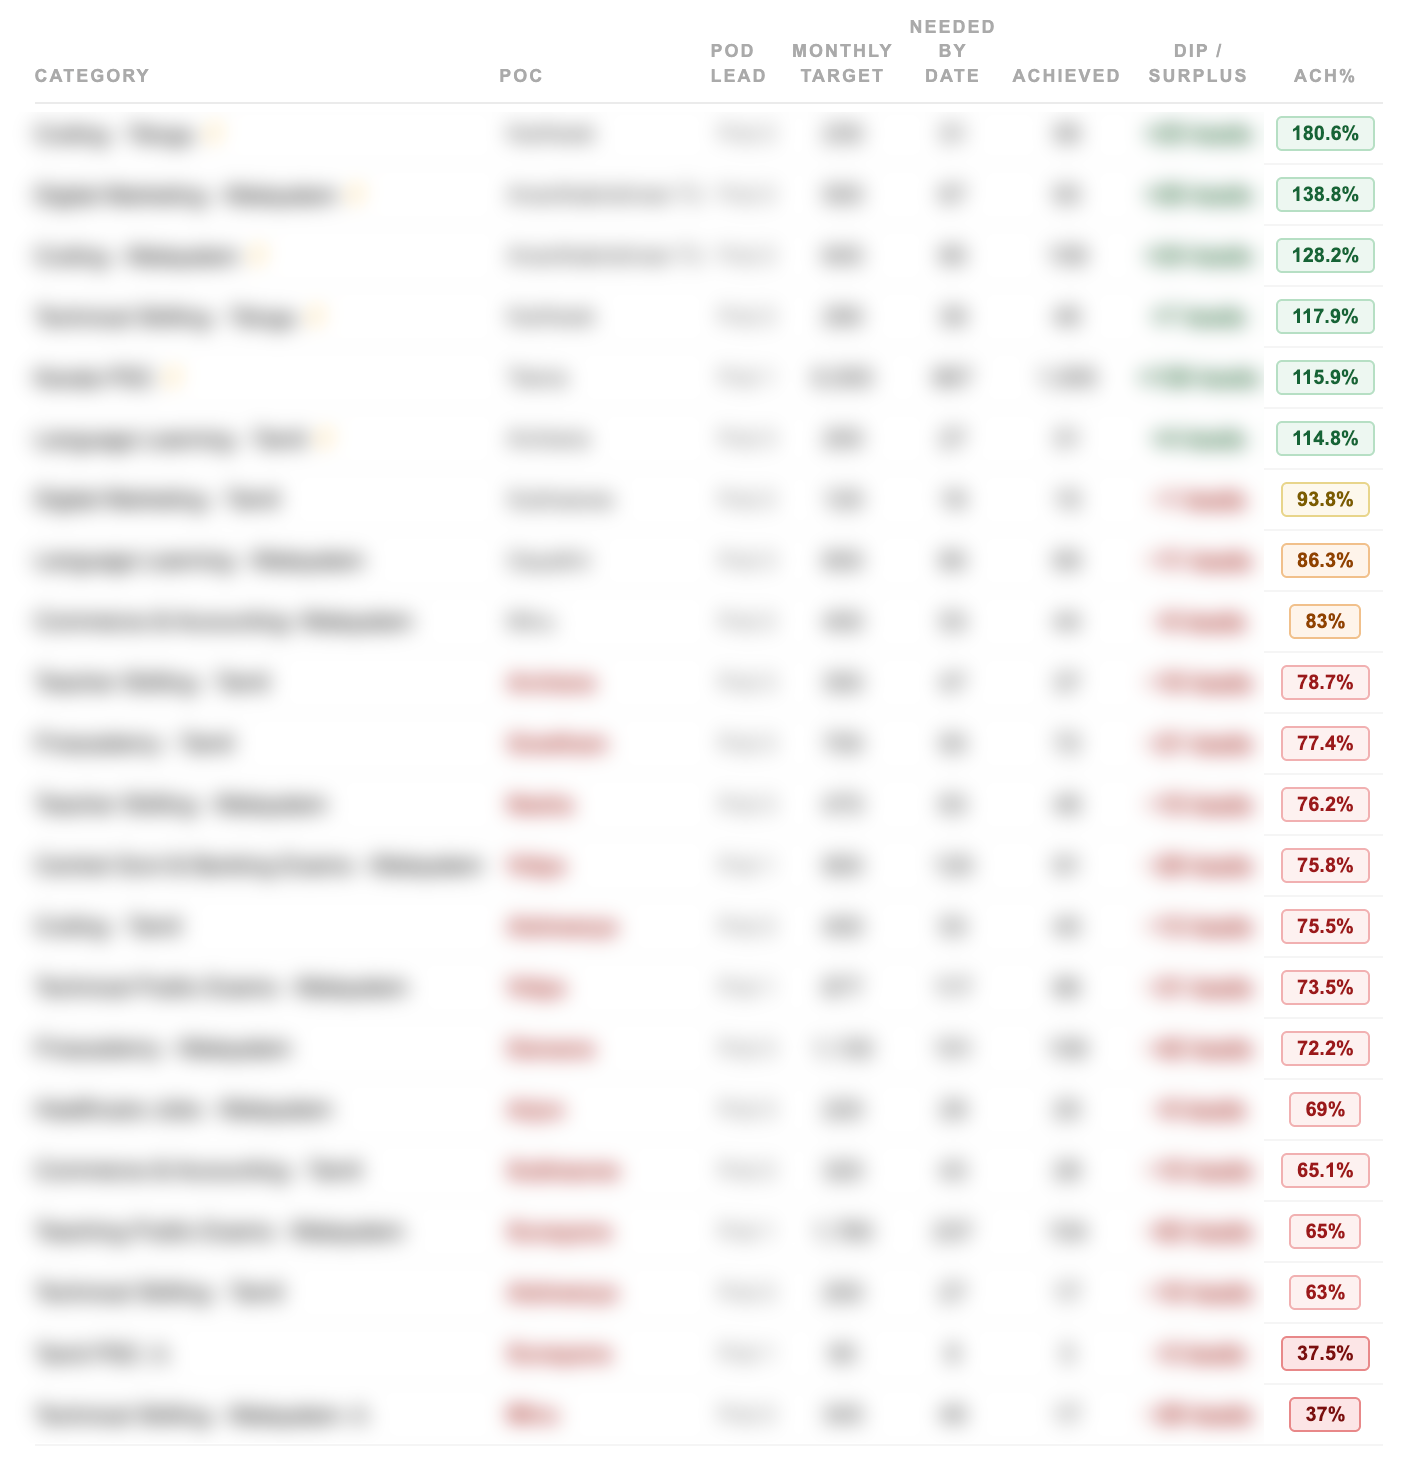
Say you have 25 active lead categories. Each with a different owner, a different monthly target, a daily run rate that shifts as the month progresses. Now someone has to walk into a meeting and have all of that calculated, current, and ready to present. Every single morning. The calculation is doable — but doing it manually, before a meeting, under time pressure, is a design failure dressed up as a routine.</p>

<p>I started thinking about what the meeting would look like if everyone already knew the numbers before they walked in.</p>

<hr />

<h2 id="what-i-actually-needed">What I actually needed</h2>

<p>Not a better dashboard. We had a dashboard.</p>

<p>The problem wasn’t visibility. It was the gap between data existing and data being useful. Processed, ranked, delivered to the right people before they need to ask for it.</p>

<p>
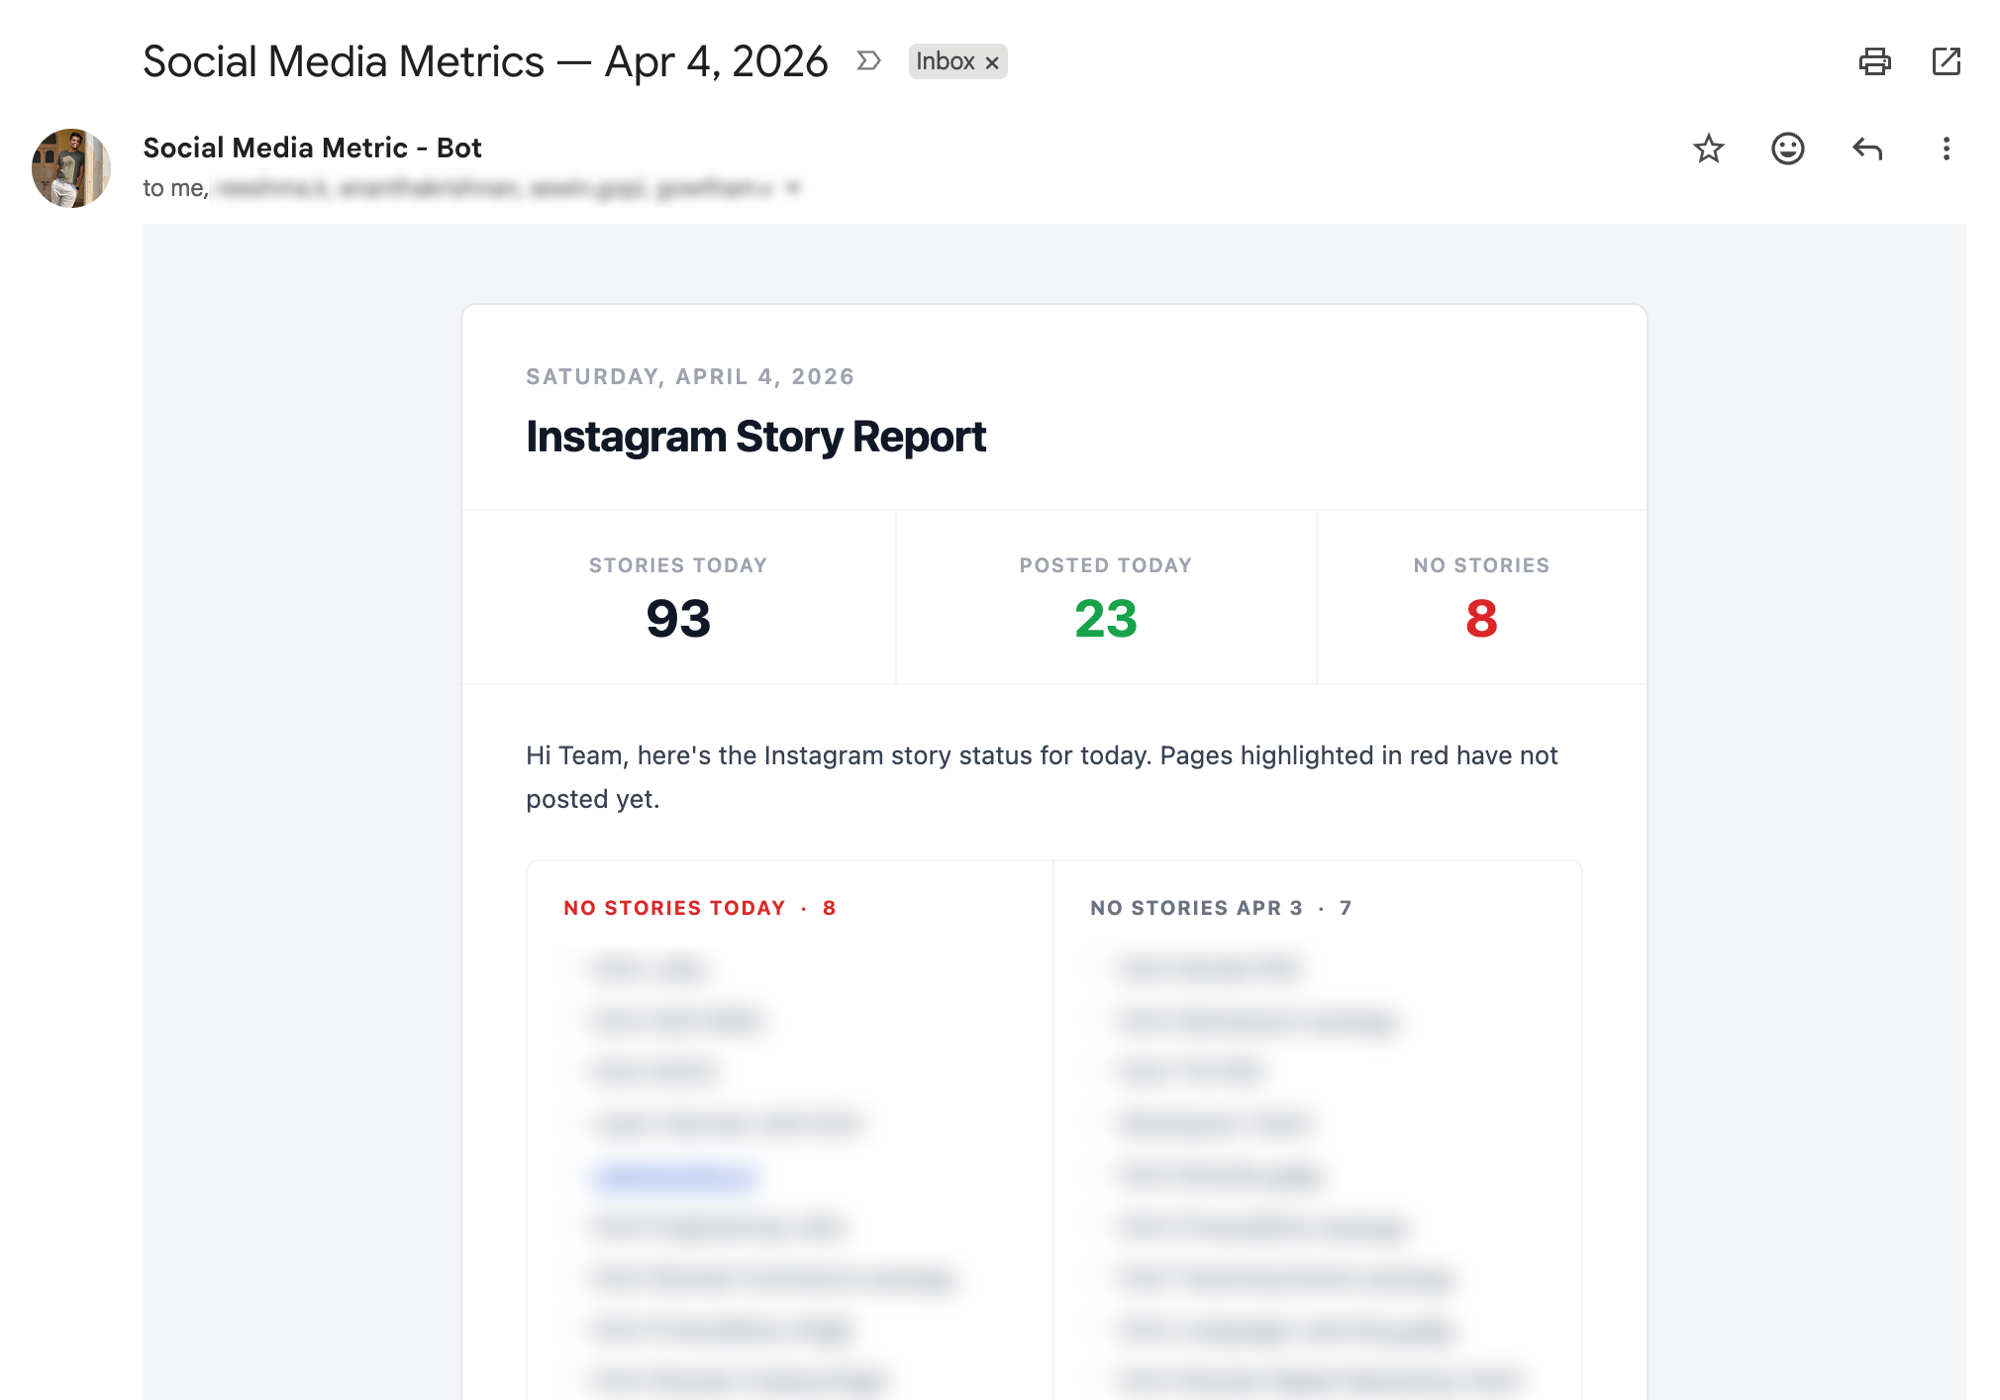
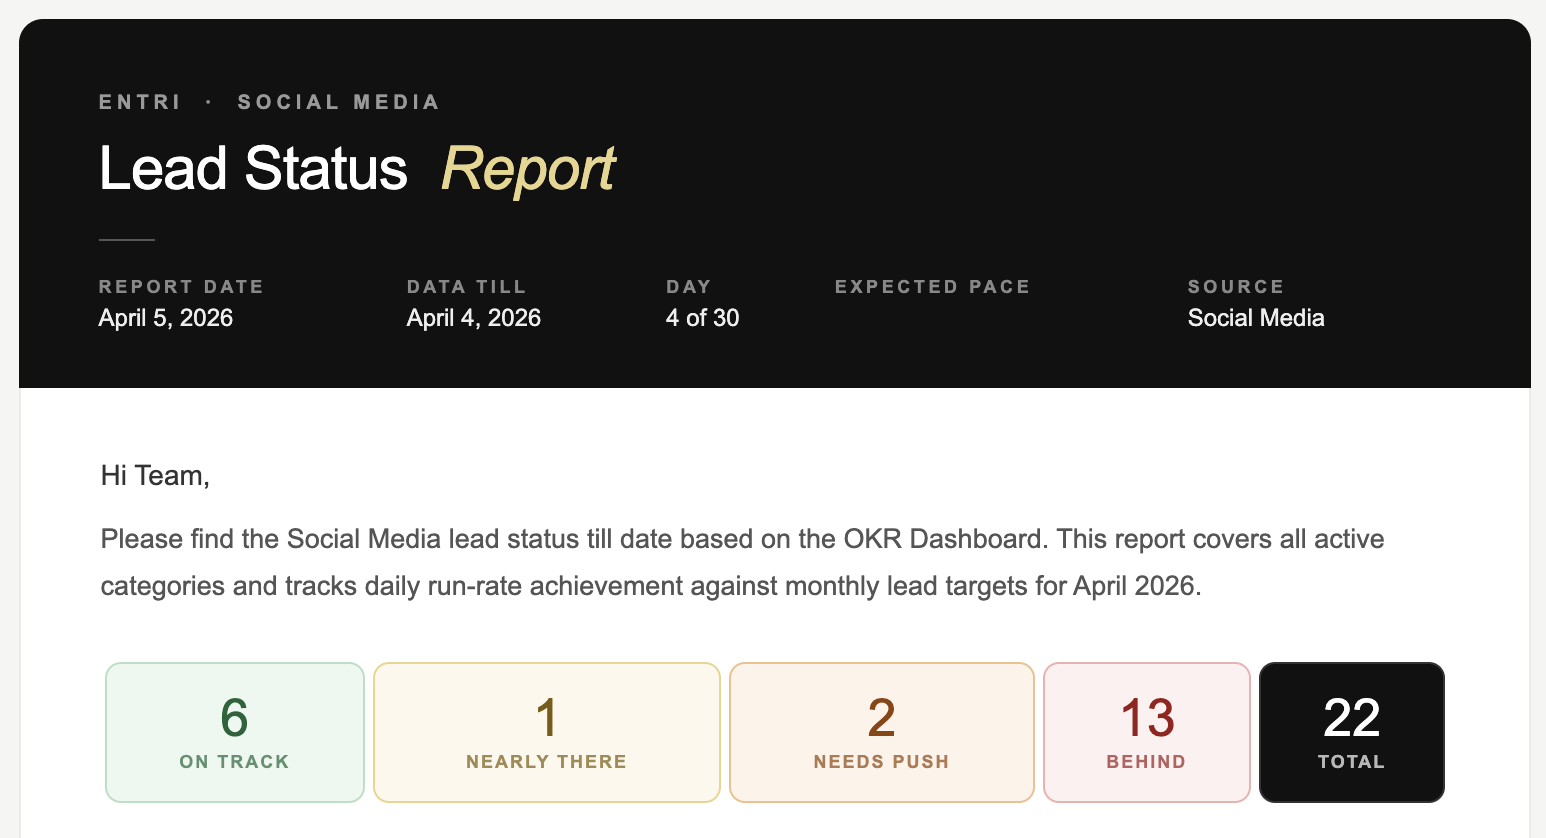
I wanted one thing: an email that lands every morning before the first meeting. Not a data dump. A briefing. The kind a sharp analyst would prepare — except it shows up automatically, every single day, whether anyone remembers to ask for it or not.</p>

<p>
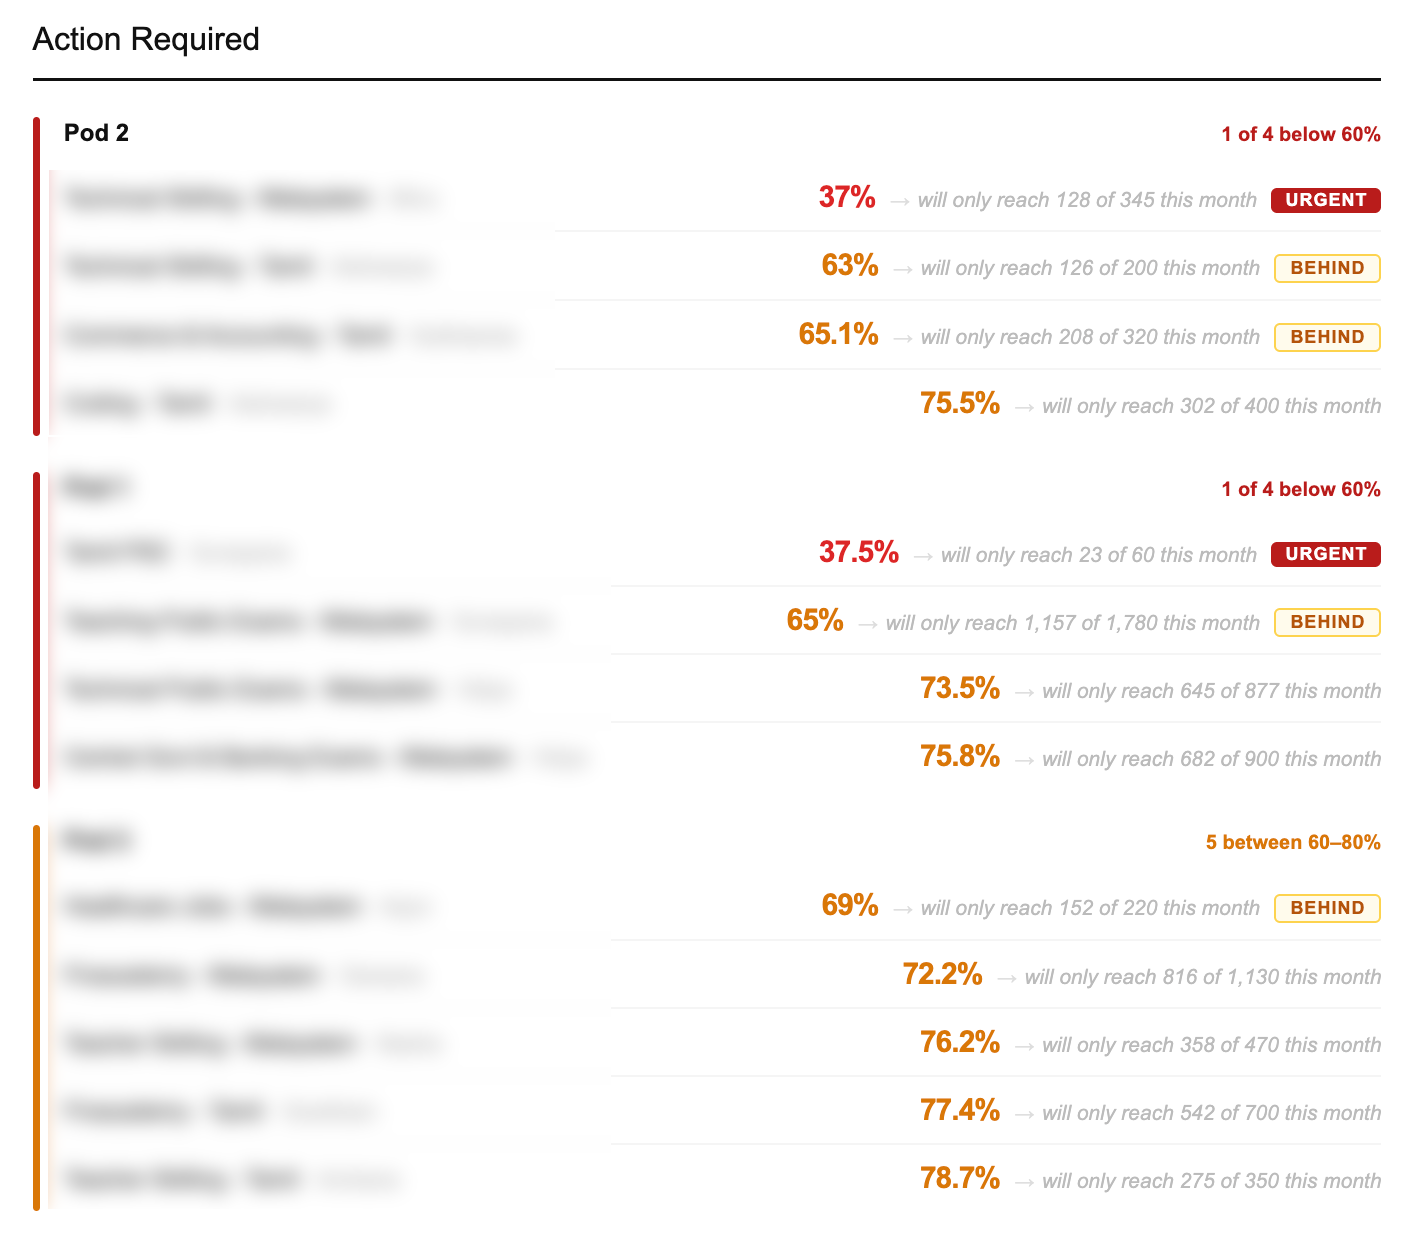
Which categories are bleeding. Who owns them. How far behind. Where they finish if nothing changes today. In that order, by urgency. Not alphabetically. Not by team. By how badly they need attention right now.</p>

<p>That’s it. The whole idea. Completely obvious once you say it out loud. Completely missing from how we were actually operating.</p>

<figure>
<img src="/assets/images/okr-email-header.png" alt="Automated lead status report — email header and status summary" />
<figcaption>Numbers and figures shown are illustrative, for demonstration purposes only. Actual data is confidential.</figcaption>
</figure>

<hr />

<h2 id="building-it">Building it</h2>

<p>I built the whole thing with Claude Code. No data team. No engineering backlog. Just a clear problem, a clear output, and enough iterations until it worked.</p>

<p>The logic isn’t complicated once you write it down. Take the data. Calculate how each category is performing against where it should be on this specific day of the month. Not the monthly target, but the expected pace right now. Rank by gap. Flag the owner. Project the finish. Send every morning before the day starts.</p>

<p>What took time was getting the projections right. Not just “you’re behind.” More like: “at this pace, you’ll finish at 71% of target by month end.” That number is what changes a conversation. It turns “we’re a bit behind” into “we will miss by this much unless something changes today.”</p>

<p>That specificity is what makes people act. Vague warnings get noted. Precise consequences get addressed.</p>

<figure>
<img src="/assets/images/okr-action-required.png" alt="Action required section — categories flagged by urgency, with projected month-end shortfall" />
<figcaption>Numbers and figures shown are illustrative, for demonstration purposes only. Actual data is confidential.</figcaption>
</figure>

<figure>
<img src="/assets/images/okr-categories-table.png" alt="Full category breakdown — all leads ranked by achievement percentage against expected pace" />
<figcaption>Numbers and figures shown are illustrative, for demonstration purposes only. Actual data is confidential.</figcaption>
</figure>

<hr />

<h2 id="what-the-meeting-looks-like-now">What the meeting looks like now</h2>

<p>People walk in already knowing.</p>

<p>The email is already there when the day starts. Everyone’s seen it. The categories that need attention are identified. The POCs already know they’re flagged. Sometimes the problem is already being addressed before the meeting starts.</p>

<p>The meeting stopped being a data retrieval session and became what it was always supposed to be: a decision-making session.</p>

<p>The data is still from yesterday. The source system hasn’t changed. But the gap between <em>data exists</em> and <em>team has processed it and is ready to act</em> went from however long it used to take, to zero.</p>

<p>That’s the only gap that actually mattered.</p>

<hr />

<hr />

<p><strong>Why not just fix the dashboard to update in real time?</strong>
That would solve the data freshness problem but not the processing problem. Someone still has to open it, read it, calculate the gaps, identify who’s behind, and summarise for the team. The bottleneck isn’t the dashboard — it’s the manual steps between data and decision.</p>

<p><strong>How do you handle multiple POCs across different categories?</strong>
The system maps every category to its owner. When something is flagged, the name is right there — no cross-referencing, no asking around. The value isn’t just knowing what’s broken. It’s knowing who to talk to about it before the meeting starts.</p>

<p><strong>Can you build internal reporting tools without a data or engineering team?</strong>
Yes — if you can clearly describe what you want the output to look like and what logic should drive it. The hard part was never writing the code. It was thinking through the rules: what counts as “behind”, how to calculate a projection, what order things should surface in. Once that thinking is done, the rest follows.</p>

<p><strong>How do you automate a daily performance report for a sales or lead generation team?</strong>
Define the output first: what does the team need to know, in what order, before the first meeting of the day. Then build logic that pulls data, calculates each category’s position against its expected daily run rate, ranks by gap, and sends the result on a schedule. The key is making the report arrive before anyone needs to ask for it — not on demand, but automatic.</p>

<p><strong>What is a lead run rate and how do you calculate it?</strong>
Run rate is how many leads a category needs to generate per day to hit its monthly target. If the monthly target is 300 and the month has 30 days, the daily run rate is 10. On Day 15, the expected total is 150. If the category has only reached 100, it’s at 67% of expected pace — behind. Projecting forward: at 100 leads in 15 days, it will finish at 200 out of 300 — 67% of target. That projected finish number is what makes teams act.</p>

<p><strong>How do you replace manual pre-meeting calculations with automation?</strong>
Identify what someone is calculating manually before each meeting. Write down the exact logic — what data they pull, what formula they apply, what order they present it in. Then build a script that does the same calculation on a schedule and delivers the output before the meeting starts. The goal isn’t a better dashboard. It’s removing the human step between data existing and the team being ready to use it.</p>

<p><strong>What should a daily OKR status email include?</strong>
The most useful format: overall status at a glance (how many categories are on track vs behind), then a ranked list of categories that need attention — sorted by urgency, not alphabetically. Each entry should show the category name, the owner, the current achievement percentage, and the projected month-end finish if nothing changes. That last number — the projection — is what drives decisions. Everything else is context.</p>]]></content><author><name>Jithin Raaj</name><email>jithinrajtk@gmail.com</email></author><category term="automation" /><category term="okr" /><category term="internal-tools" /><category term="claude-code" /><category term="data" /><category term="social-media" /><category term="lead-generation" /><category term="reporting-automation" /><category term="daily-report" /><category term="performance-tracking" /><summary type="html"><![CDATA[How to automate a daily lead generation performance report — pulling OKR data, calculating run rates, ranking categories by urgency, and delivering a briefing email before the first meeting. Built without a data or engineering team.]]></summary></entry><entry><title type="html">I Was “Monitoring” 25+ Instagram Pages. I Was Just Wasting Time.</title><link href="https://jithinraaj.in/writing/storydash-monitoring-instagram-pages/" rel="alternate" type="text/html" title="I Was “Monitoring” 25+ Instagram Pages. I Was Just Wasting Time." /><published>2026-04-05T00:00:00+00:00</published><updated>2026-04-08T00:00:00+00:00</updated><id>https://jithinraaj.in/writing/storydash-monitoring-instagram-pages</id><content type="html" xml:base="https://jithinraaj.in/writing/storydash-monitoring-instagram-pages/"><![CDATA[<p>Every morning, the routine was the same.</p>

<p>Open Instagram. Check page one. Stories posted? Good. Check page two. Stories? Yes. Check page three…</p>

<p>Twenty-five pages later, thirty minutes had passed. And I hadn’t done anything useful. I’d just <em>confirmed</em> that things existed.</p>

<p>That’s not monitoring. That’s just time disappearing.</p>

<p>This post covers how to monitor Instagram story activity across 25+ pages without opening the app — including how to catch story spacing violations that quietly hurt reach, how to build an internal Instagram story analytics dashboard, and how to set up automated hourly email reports. Built entirely with Claude Code by someone running content operations, not engineering.</p>

<hr />

<h2 id="the-problem-i-didnt-know-i-had">The problem I didn’t know I had</h2>

<p>When you’re managing 25+ pages, there’s an issue that doesn’t show up anywhere: it’s not <em>whether</em> you post stories. It’s <em>when</em>.</p>

<p>Stories posted too close together don’t get distributed the way you’d expect. The algorithm sees a burst, not a cadence. Reach drops. Views thin out. And because you can’t manually track gaps across that many pages, it just keeps happening quietly.</p>

<p>We were posting stories two minutes apart on some pages. Sometimes one minute. We had no idea.</p>

<hr />

<h2 id="so-i-built-storydash--an-instagram-story-monitoring-dashboard">So I built StoryDash — an Instagram story monitoring dashboard</h2>

<p>StoryDash is an internal Instagram monitoring dashboard that tracks story activity across multiple pages in one view, flags story spacing violations in real time, and sends automated hourly email reports — all without opening the app.</p>

<p>An internal dashboard. One screen. Every page, every story posted today, when each was last active, and whether the spacing is within the safe window.</p>

<p><img src="/assets/images/storydash-overview.png" alt="StoryDash overview, all pages, story counts, and status at a glance" /></p>

<p>37 pages. 96 stories today. 21 pages active. The ones with nothing posted and the ones breaking spacing rules, right there, without opening Instagram once.</p>

<hr />

<h2 id="catching-instagram-story-spacing-violations-automatically">Catching Instagram story spacing violations automatically</h2>

<p>When I added the spacing check, I expected maybe two or three pages with issues.</p>

<p><img src="/assets/images/storydash-violations.png" alt="Story spacing violations, pages with consecutive stories posted too close together" /></p>

<p>It was more than that. Multiple pages posting consecutive stories less than a minute apart. Some flagged critical. This had been happening every single day and we’d never caught it.</p>

<p>I showed this to the team. Nobody spoke for a second.</p>

<hr />

<h2 id="per-page-instagram-story-analytics-timestamps-thumbnails-and-spacing">Per-page Instagram story analytics: timestamps, thumbnails, and spacing</h2>

<p>Click any page, see the full day: thumbnails, timestamps, exactly where the gaps are too short.</p>

<p><img src="/assets/images/storydash-page-detail.png" alt="Per-page detail view with story thumbnails and frequency warning" /></p>

<p>Three pairs of stories posted under 30 minutes apart. Worst gap: 0 minutes. The dashboard shows the exact violation and the recommended minimum, so the person managing that page knows what to fix, not just that something’s wrong.</p>

<hr />

<h2 id="the-email-that-arrives-without-anyone-asking">The email that arrives without anyone asking</h2>

<p>The dashboard solved the need to check. But I wanted to remove the need to check the dashboard too.</p>

<p>Hourly automated email. Every hour: pages that posted, pages that haven’t, which ones need attention.</p>

<p><img src="/assets/images/storydash-email-report-clean.png" alt="Automated hourly email report, stories today, pages posted, pages with no stories" /></p>

<p>93 stories tracked. 23 pages posted. 8 with nothing yet, highlighted.</p>

<p>The information arrives. No one has to open anything.</p>

<hr />

<h2 id="how-i-built-an-instagram-monitoring-tool-with-claude-code-no-engineers">How I built an Instagram monitoring tool with Claude Code (no engineers)</h2>

<p>Built with <strong>Claude Code</strong>: dashboard, spacing logic, automated emails, all of it.</p>

<p>The process was: describe the problem in plain language, see what gets built, describe what’s wrong or missing, iterate. No ticket raised. No engineer looped in. No technical spec written.</p>

<p>I started with the core problem: I need to see story activity across all pages in one view. Claude Code built the dashboard. Then spacing detection: flag anything under 30 minutes between consecutive stories. It added the logic and the violations view. Then the email report: send this data hourly, formatted cleanly. Done.</p>

<p>Three features. One clear problem statement each time. The whole thing went from idea to running in production without once opening a code editor.</p>

<p>I manage content operations. Building tools is not a skill I have. That’s the point.</p>

<p><em>Running in production.</em> Full project overview: <a href="/projects/storydash/">StoryDash →</a></p>

<hr />

<h2 id="what-you-need-to-build-an-instagram-story-monitoring-tool">What you need to build an Instagram story monitoring tool</h2>

<p>The foundation is the <strong>Instagram Graph API</strong> — Meta’s official API for accessing story data from pages you manage. To use it:</p>

<ul>
  <li>A Facebook developer account and an approved app</li>
  <li>Instagram Business or Creator accounts (personal accounts have no API access)</li>
  <li>Page access tokens for each account you want to monitor</li>
</ul>

<p>The API returns story media objects with timestamps. From there, the spacing logic, the dashboard, and the email report are all built on top of that data.</p>

<p>Most teams don’t have this. Not because it’s technically hard. It just requires an engineer to set up and never gets prioritised against product work. Claude Code removes that dependency entirely.</p>

<hr />

<h2 id="how-to-monitor-multiple-instagram-accounts-at-scale">How to monitor multiple Instagram accounts at scale</h2>

<p>The pattern works whether you’re building your own tool or evaluating options. Four things you need:</p>

<p><strong>1. A single data source for all pages</strong>
Pull story data via the Instagram Graph API — timestamps, media count, last activity per page. If your data lives in separate places (or only inside the app), you’ll always be checking manually.</p>

<p><strong>2. One view across all accounts</strong>
All pages, story counts, last active time, and posting status in a single screen. The moment you have to click into individual pages, the system breaks down at scale.</p>

<p><strong>3. Automated spacing checks</strong>
Set a minimum gap threshold (30–60 minutes is the safe range). Flag anything under it automatically. Without this, spacing violations happen silently every day. You only find out when reach drops.</p>

<p><strong>4. Proactive reporting</strong>
Information should find you, not the other way around. Scheduled email reports (hourly or daily) mean the team always knows the status without anyone opening a dashboard. If you’re still pulling the data yourself, you’ve built a lookup tool, not a monitoring system.</p>

<p>StoryDash was built around these four. But the architecture applies to any Instagram monitoring setup at scale.</p>

<hr />

<hr />

<p><strong>Does posting Instagram stories too close together hurt reach?</strong>
Yes. Stories posted within minutes of each other are treated as a burst by the algorithm, not a cadence. Reach and views thin out. A minimum gap of 30 to 60 minutes between stories is the recommended safe window for consistent distribution.</p>

<p><strong>How do you monitor Instagram story activity across multiple pages without opening the app?</strong>
Build a dashboard that pulls story data and displays post times, gaps between stories, and pages with no activity in one view. Pair it with automated email reports so the information arrives on a schedule rather than requiring anyone to check manually.</p>

<p><strong>Can you build internal social media tools without a developer?</strong>
Yes. Claude Code lets you go from a clear problem description to a working internal tool without engineering resources. StoryDash was built this way: dashboard, backend logic, and automated reports, by someone managing content operations.</p>

<p><strong>What is the best tool to manage multiple Instagram pages at once?</strong>
A custom internal dashboard built around your specific pages beats any generic third-party tool for teams managing 25+. Most third-party tools focus on scheduling, not monitoring. The real gap is real-time visibility — knowing which pages have posted stories today, which haven’t, and whether story frequency is within safe limits. A tool like StoryDash solves this because it’s purpose-built for your workflow, not a broad audience.</p>

<p><strong>How do you track Instagram stories across multiple accounts?</strong>
The reliable way is to pull story data via the Instagram Graph API into a single dashboard, showing all accounts in one view with timestamps and activity status. This removes the need to manually open each account. Pair it with automated reports sent on a schedule so the team always knows the status without checking.</p>

<p><strong>What is Instagram story spacing and why does it matter?</strong>
Story spacing is the time gap between consecutive stories on a single page. When stories are posted too close together — under 30 minutes — the algorithm treats it as a burst and reduces distribution. Each story gets fewer views than it would with proper spacing. At scale, across many pages, this happens constantly and silently unless you have a system that tracks and flags it.</p>

<p><strong>How do you manage Instagram content operations at scale?</strong>
Content operations at scale means replacing manual checks with systems that surface the right information automatically. For Instagram specifically: a monitoring dashboard that shows story activity across all pages at once, automated alerts for spacing violations, and scheduled email reports that deliver status updates without anyone needing to open a dashboard. The goal is to make the team’s default state informed, not reactive.</p>

<script type="application/ld+json">
{
  "@context": "https://schema.org",
  "@type": "FAQPage",
  "mainEntity": [
    {
      "@type": "Question",
      "name": "Does posting Instagram stories too close together hurt reach?",
      "acceptedAnswer": {
        "@type": "Answer",
        "text": "Yes. Stories posted within minutes of each other are treated as a burst by the algorithm, not a cadence. Reach and views thin out. A minimum gap of 30 to 60 minutes between stories is the recommended safe window for consistent distribution."
      }
    },
    {
      "@type": "Question",
      "name": "How do you monitor Instagram story activity across multiple pages without opening the app?",
      "acceptedAnswer": {
        "@type": "Answer",
        "text": "Build a dashboard that pulls story data and displays post times, gaps between stories, and pages with no activity in one view. Pair it with automated email reports so the information arrives on a schedule rather than requiring anyone to check manually."
      }
    },
    {
      "@type": "Question",
      "name": "Can you build internal social media tools without a developer?",
      "acceptedAnswer": {
        "@type": "Answer",
        "text": "Yes. Claude Code lets you go from a clear problem description to a working internal tool without engineering resources. StoryDash was built this way: dashboard, backend logic, and automated reports, by someone managing content operations."
      }
    },
    {
      "@type": "Question",
      "name": "What is the best tool to manage multiple Instagram pages at once?",
      "acceptedAnswer": {
        "@type": "Answer",
        "text": "A custom internal dashboard built around your specific pages beats any generic third-party tool for teams managing 25+. Most third-party tools focus on scheduling, not monitoring. The real gap is real-time visibility — knowing which pages have posted stories today, which haven't, and whether story frequency is within safe limits."
      }
    },
    {
      "@type": "Question",
      "name": "How do you track Instagram stories across multiple accounts?",
      "acceptedAnswer": {
        "@type": "Answer",
        "text": "The reliable way is to pull story data via the Instagram Graph API into a single dashboard, showing all accounts in one view with timestamps and activity status. This removes the need to manually open each account. Pair it with automated reports sent on a schedule so the team always knows the status without checking."
      }
    },
    {
      "@type": "Question",
      "name": "What is Instagram story spacing and why does it matter?",
      "acceptedAnswer": {
        "@type": "Answer",
        "text": "Story spacing is the time gap between consecutive stories on a single page. When stories are posted too close together — under 30 minutes — the algorithm treats it as a burst and reduces distribution. Each story gets fewer views than it would with proper spacing. At scale, across many pages, this happens constantly and silently unless you have a system that tracks and flags it."
      }
    },
    {
      "@type": "Question",
      "name": "How do you manage Instagram content operations at scale?",
      "acceptedAnswer": {
        "@type": "Answer",
        "text": "Content operations at scale means replacing manual checks with systems that surface the right information automatically. For Instagram specifically: a monitoring dashboard that shows story activity across all pages at once, automated alerts for spacing violations, and scheduled email reports that deliver status updates without anyone needing to open a dashboard."
      }
    }
  ]
}
</script>]]></content><author><name>Jithin Raaj</name><email>jithinrajtk@gmail.com</email></author><category term="instagram" /><category term="automation" /><category term="claude-code" /><category term="social-media" /><category term="internal-tools" /><category term="content-operations" /><category term="instagram-monitoring" /><category term="story-tracking" /><category term="multiple-pages" /><category term="social-media-dashboard" /><summary type="html"><![CDATA[How to monitor Instagram stories across 25+ pages without opening the app — a custom dashboard with story spacing violation alerts, per-page tracking, and automated hourly email reports. Built with Claude Code without an engineering team.]]></summary><media:thumbnail xmlns:media="http://search.yahoo.com/mrss/" url="https://jithinraaj.in/assets/images/storydash-overview.png" /><media:content medium="image" url="https://jithinraaj.in/assets/images/storydash-overview.png" xmlns:media="http://search.yahoo.com/mrss/" /></entry></feed>